
September 8, 2025
Quantitative Schedule and Cost Risk Analysis: Part 2
Engineering and construction projects frequently overrun their planned completion dates and budgeted total costs. Very large and complex projects, often called “megaprojects,” may be especially risky and are sometimes described as “fragile” because issues in completing a key task in one area often affect other areas, which may ultimately cause significant schedule and cost overruns for the entire project.
This is the second of two blog posts on quantitative schedule and cost risk analysis. The first post covered the purpose of this type of analysis, its typical results, and how the results are used. This second post addresses components of a well-structured quantitative schedule and cost risk analysis procedure. When implementing such a procedure, it is recommended to consider the following topics.
Corporate Culture: For a risk analysis to be successful, the project stakeholders must be committed to conducting an independent, unbiased, and realistic analysis of project risks. The stakeholders also must utilize the risk analysis output by prioritizing the risk events to be mitigated to improve the project schedule and cost. Management must avoid telling the risk analysis team which answers would be “acceptable” before they do their work.
This culture starts at the top of the organization but involves everyone participating in the project and others with staff responsibility. Without supportive management, the risk analysis may be hindered or ignored and will not be used to its fullest potential (e.g., by not communicating the results to stakeholders, using the results to make strategic decisions, or executing the recommended mitigation actions). Risk analyses are less successful if they are only performed to “check a box” on a list or because procedures require the analysis. Some organizations even ignore the presence of project risk entirely. Risk-aware organizations, however, benefit from introducing the schedule and cost risk component early in the decision phase (analysis of alternatives).1
Quality of the Project Schedule: Reliable Monte Carlo simulations must have good-quality project schedules that represent the full scope of the project plan. Do not assume that the schedule is compliant with best practice scheduling.
Because the schedule is the platform for quantitative schedule risk analysis, the analyst should perform schedule reviews to ensure that the schedule is based on best scheduling practices and correct schedule problems such as reliance on long or negative lags in the schedule, logic with open ends, hard constraints, unrealistic total float, and missing scope of work activities. On occasion, the schedule may be too large and/or contain too many schedule warnings to be repaired. When this is true, the analyst should create a summary analysis schedule that represents the project plan and complies with best scheduling practices. Securing agreement from the contractor and owner that the summary schedule represents the project plan before performing the risk analysis is recommended.
Risk Data Collection – Problem with Risk Registers: In quantitative risk analysis, risks are assessed by their probability and potential impact on completion dates or total project cost. The discrete risks are often thought of as being reducible by mitigation (for threats) or expansible by enhancement (for opportunities).
Risk registers usually do not include the risks that turn out to be the most consequential to the project achieving the best possible schedule completion and cost. One reason is that risk registers are often developed in workshops, and the risk workshop environment often contains various biases, so much so that some of the most important risks cannot even be discussed.2
Risk analysis participants at all levels, from team members to corporate management, have different perspectives and can contribute insights from their own experience. Gathering data from Subject Matter Experts (SMEs) can take several forms, such as carefully planned voting experiments, group risk workshops, or individual confidential interviews. Each of these has its place, but our experience is that confidential individual risk interviews have crucial benefits that enhance the quality of the analysis risk data. Using the best quality risk data available is a key to the success and usefulness of the risk analysis results.
Providing the interviewees a “safe” environment allows them to bring up these consequential risks that are missing from the risk registers. Our experience is that several new and ultimately most consequential risks are introduced when confidential interviews are performed.
Representing the Impact of Risks on Activities’ Durations: Risk registers do not accurately represent risk impacts. In risk register development, the concept of impact is the number of days added to the finish date if the risk occurs. It is very difficult to estimate the impact on the finish date because the schedule logic and paths are not known at that point.
The preferred impact concept is to identify activities that the risk will affect if it happens and calibrate the impact of the risk on their scheduled remaining durations or costs. This method estimates the impact on activities and costs and relies on the schedule logic to calculate the impact on the completion date during simulation.
Possible discontinuous events, such as failing a qualifying test, can have consequences beyond adding duration to existing activities or cost to an existing budget element. Failing a test (or other discontinuous events) may require adding activities to the schedule and cost line items that represent recovery from the event. Such activities often include tasks for root cause analysis of the incident, planning the recovery, executing the recovery, and then re-testing the failed item. These activities and cost elements are almost certain not to be in the schedule or cost estimate because activities and cost of the work are usually based upon success, not failure.
Distribution of Days Added If the Risk Occurs: This approach is difficult to apply in quantitative risk analysis when the risk affects more than one activity. Conceptually, added days could be apportioned to multiple activities or spread out over all affected activities, or one activity may be chosen to take the entire risk.
The recommended approach to represent the impact of a risk on activity durations uses Risk Drivers, where impacts are calibrated as a distribution of multiplicative factors to be sampled from and applied to all the impacted activities’ scheduled durations.3 Scaling risk drivers’ impact using this proportionality facilitates the assignment of the risk to all affected activities. This approach enables activities with different durations to model the risk’s impacts correctly. If a risk affects multiple activities, say the piping phase of the project, the output results for that phase will have the same percentage duration range as the inputs derived from the confidential interviews.
Properly Correlate Risks to Activity Durations: Correlation of risks to activity durations can cause project schedule lengthening that the analysis should capture. However, trying to identify and assign correlation coefficients to pairs of activities manually, even though simulation software supports this method, often produces correlation coefficients that are internally inconsistent.4
Risk correlation between activity durations arises when risks affect two or more activities. Using risk drivers that apply risks to multiple activities creates correlation between activity durations during the Monte Carlo simulation. Because correlation actually arises in this manner, the correlation coefficient matrix is never impossible.5 Thus, team meetings to try to assign correlation coefficients to multiple pairs of durations or of cost elements are unnecessary.
Determine the Effect on Time-Dependent Resources: Risk-caused activity duration variability will cause time-dependent resources (e.g., labor, rented construction equipment, field office personnel) to cost more than planned, adding to the cost contingency. Thus, the risk-driven simulation results need to drive costs of time-dependent resources in each iteration without regard to the contract structure.6
Prioritization of Risks: It is premature to use risk registers to identify the risks that most need risk mitigation actions. Prioritizing risks has typically been performed by developing a “tornado diagram” that sorts the risks according to their correlation with the completion date or project cost. This approach is not entirely useful for management to make decisions about whether the cost of mitigation is warranted (e.g., if a mitigation action costs $5 million and reduces the correlation from 70% to 40%, how is management to value that benefit against $5 million?).
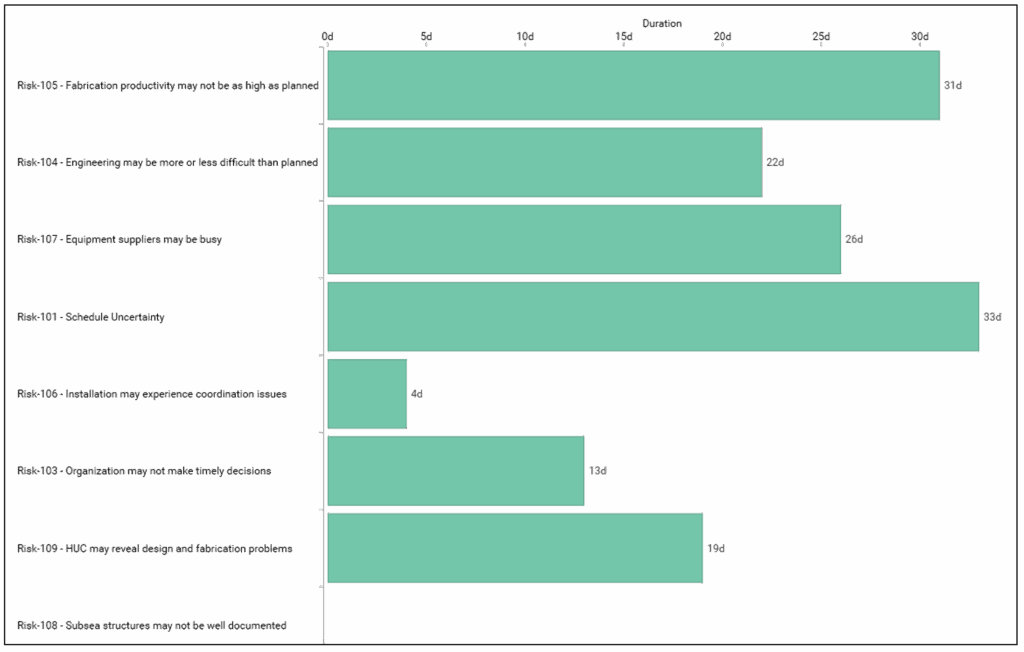
A more useful “multi-pass” simulation method that sorts the risk by “days saved if fully mitigated” allows management to make economic decisions based on the cost of the mitigation actions compared to the days saved, as shown in Figure 1 below. The risk that fabrication productivity may be lower than planned (Risk 105) should be the risk addressed first. Then, the risk that engineering may be more or less difficult than planned (Risk 104) should be addressed, and so on in order that the risks appear down the list from the multi-pass sensitivity analysis output. Schedule Uncertainty (“Risk” 101) is important after the top three risks are mitigated, but uncertainty cannot be mitigated.7
Figure 1
Impact of Risks on P80 Project Completion Date
(Sensitivity Method: Multiple Passes)
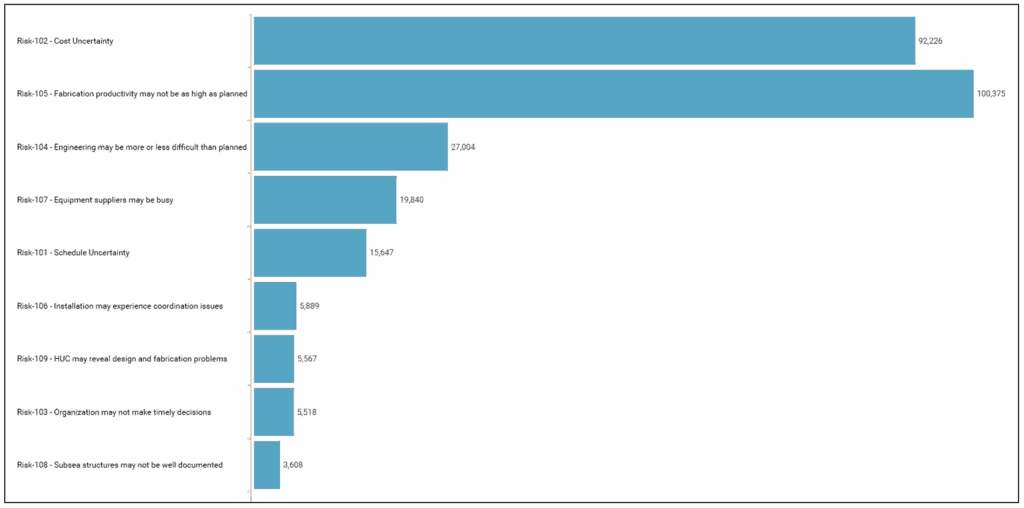
A multi-pass simulation method that sorts the risk’s effect on cost allows management to make economic decisions based on the cost of the mitigation actions compared to the reduction of the risk’s cost if fully mitigated, as shown in Figure 2 below. Low fabrication productivity (Risk 105) is the risk that justifies the highest level of cost mitigation since Cost Uncertainty (Risk 102) cannot be mitigated but is important. Notice that the cost risk results include schedule uncertainty because of the “knock-on” effect from schedule risk that affects the cost of time-dependent resources.
Figure 2
Impact of Risks on P-80 Project Costs
(Sensitivity Method: Multiple Passes)
Of course, these risks are seldom fully eliminated by the mitigation actions taken. Eliminating the risks to cost or to schedule during the multi-pass simulations is mainly a way to prioritize the risks for attention during simulation. The mitigation workshop determines the reduction of cost or schedule risk that can be expected with the mitigation actions taken. The comparison between the cost of the actions and the improvement in days or dollars saved determines the value of the risks being mitigated.
Risk Mitigation Workshops: Avoid allowing strong personalities or high-level management to influence (take over) risk mitigation workshops. These individuals sometimes use the workshop to produce implausibly successful post-mitigation probability and impact coefficients. The cost of mitigation measures may not produce sufficient post-mitigation improvement to lead to approval of implementing the actions.8 We recommend that the risk mitigation team apply a scoring system to develop useful mitigation measures to justify post-mitigated probability and impact values.
1 AACE RP 127R-23, “Choosing Among Strategic Alternatives using Branching Concepts in Decision Modeling,” for applying risk concepts and modeling at the analysis of alternatives decision stage.
2 A. Tversky and D. Kahneman, “Judgement under Uncertainty and Biases,” Science, 1974,1 85(457), pp. 1124–1131.
3 For example, if a risk affects a 20-day duration activity, the risk driver’s impacts would be taken from a probability distribution with 3-point estimates of 0.95, 1.05, and 1.25 rather than at risk register’s 19 days, 21 days, and 25 days.
4 Suppose a correlation workshop believes that the duration variability of activity A is 90% correlated with that of activity B, and that activity A is 80% correlated with activity C. This implies that the duration variability of activities B and C must be highly correlated, say not lower than 50%. However, it often happens that the workshop assesses the duration correlation of activities B and C as 20%. This B–C correlation coefficient is too low to be consistent with the 80% and 90% correlation with the common activity A; therefore, it cannot occur. However, it may be generated by workshops that are trying to fill out the pair-wise correlation coefficient matrix. Software will not simulate with inconsistent parameters.
5 Stephen A. Book, “A Theory of Modeling Correlations for Use in Cost-Risk Analysis,” Third Annual Project Management, Conference, NASA, Galveston, TX, March 21–22, 2006.
6 David Hulett, “Integrated Cost-Schedule Risk Analysis,” (2011, Gower Publishers). This method is embedded in the AACE International Recommended Practice 57R-09, “Integrated Cost and Schedule Risk Analysis using Risk Drivers and Monte Carlo Simulation of a CPM Schedule,” originally published in 2011, revised in 2019, and undergoing further updating in 2025.
7 The risks listed in this order is a starting point for prioritization. Since risks cannot be fully mitigated in practice, the order may change when a risk is partially mitigated rather than fully mitigated, and the analysis method may have to be repeated as risk mitigations are debated and resolved. This listing is a good starting point to identify the risks that deserve attention in the mitigation workshop.
8 AACE RISK-4401, “Assessing Proposed Risk Mitigation Actions Using Mitigation Scoring,” Waylon Whitehead and David Hulett, Cost Engineering, May–June, 2025.
ADDITIONAL RESOURCES

Blog
Discover industry insights on construction disputes and claims, project management, risk analysis, and more.
MORE

Articles
Articles by our engineering and construction claims experts cover topics ranging from acceleration to why claims occur.
MORE

Publications
We are committed to sharing industry knowledge through publication of our books and presentations.
MORE
RECOMMENDED READS
Quantitative Schedule and Cost Risk Analysis: Part 1
This blog post covers the purpose of quantitative schedule and cost risk analysis, its typical results, and how the results are used.
READ
The Role and Benefit of a Consultant in a Construction Project: Part 1
This is the first blog post in a two-part series on the role and benefit of a construction consultant.
READ
A Tale of Two Claims: Same Contract, Two Fates
The success of a claim often hinges not on what happened in the field, but how it was documented, analyzed, and communicated.
READ